Schema
Designed to be the definitive data format for sharing quantified tech impacts. Crucially, with links to the methodology used to calculate the data reported.
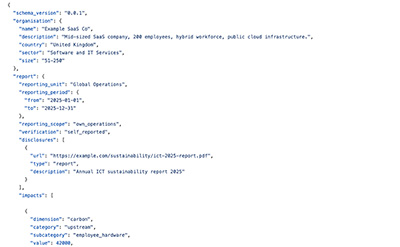
Coming soon
To track progress, you can view the schema inside the repo as we work on it.
To get involved in the shaping of the vision and implementation of this section of DIST, take a look at the issues we are working on in gtihub.
Background info
Key principle:
An impact can only come into DIST’s schema when it has a quantifiable metric against an agreed methodology.
The schema is metrics-focused: structured reporting fields are only created for impacts that have an established, quantifiable way of being measured. This keeps the schema rigorous, consistent and defensible. The DIST taxonomy will be broader and aspirational and educational.
More on what the schema is and what it isn’t:
This IS:
- An open-source schema (data structure) for reporting digital/technology impacts
- Aligned with life cycle assessment (LCA) principles and widely recognised upstream/operational/downstream categories where applicable
- Designed to be discoverable via carbon.txt and machine-readable from day one
- A foundation that other frameworks, tools, calculators and methodologies can plug into
This IS NOT:
- A prescriptive methodology (the schema defines what to report, not how to calculate it; methodologies are referenced to provide vital context for the numbers)
- A certification or compliance framework (though it should be useful for those who need to comply with regulations like CSRD)
- A commercial product (open source, dual-licensed for open adoption and ISO standardisation) but it is commercial product friendly - it can be used in commercial products and services
Use cases: what will people actually do with this?
The schema only matters if people use it. Here are the concrete things we expect different groups to do with it.
Assess and report. An organisation runs a structured assessment of their technology estate’s impacts across whichever dimensions they have data for, publishes the results as a JSON file referenced from their carbon.txt, and repeats annually to track progress. This is the core use case and everything else flows from it. Benchmark and compare. Because the schema enforces a consistent structure, reported data can be aggregated and compared across organisations for the first time. An industry body, regulator, or researcher could pull published data from multiple organisations and produce meaningful benchmarks. Today this is impossible because everyone reports differently (if they report at all).
Inform your customers. A technology vendor, whether a cloud provider, SaaS company, managed service provider, or systems integrator, publishes the impacts of the services they provide to customers in a consistent, structured format. Today, customers asking “what are the environmental and social impacts of the services you provide to us?” get wildly inconsistent answers: a PDF from one vendor, a carbon dashboard from another, nothing from a third. The schema gives vendors a single, recognised format for answering that question. Early movers gain a transparency advantage. As adoption grows, it becomes table stakes.
Procure responsibly. The flip side: a procurement team evaluating technology suppliers asks them to publish their impacts in the schema format, or includes schema-aligned reporting as a contractual requirement. This replaces the current approach of wading through PDFs and sustainability marketing, and gives procurement a structured, comparable basis for vendor selection. Public sector procurement is a particularly strong fit given existing government guidance on sustainable technology. When multiple vendors report in the same format, genuine comparison becomes possible for the first time.
Audit and verify. An auditor validates an organisation’s reported data against the schema, checking that the methodology and confidence fields are credible and that the data sources are traceable. The structured format makes this dramatically easier than auditing narrative reports.
Regulate and set policy. A regulator references the schema as a recommended or required reporting format, as the UK Government did with TCS in the GDS Service Manual. The dual licensing (open source + ISO) pathway is designed to support this. As CSRD and other sustainability reporting regulations expand, a technology-specific schema becomes increasingly useful for compliance.
Campaign and hold to account. An NGO, journalist, or activist uses published schema data to identify organisations with poor performance on specific dimensions (e.g. e-waste, societal harms) and make evidence-based cases for improvement. Machine-readable data is far harder to hide behind than a glossy sustainability report.
Build tools and services. Developers build calculators, dashboards, benchmarking platforms, and analysis tools on top of the schema. Because the data structure is open and consistent, tooling built for one organisation works for any organisation. The schema becomes infrastructure that an ecosystem of tools plugs into. Teach and learn. Educators, training providers, and professional bodies use the taxonomy as a teaching framework for technology sustainability that goes beyond carbon. The dimensions provide a structured syllabus for understanding the full breadth of technology’s impacts.
Technical details on the schema can be found in the GitHub repo which will be made available soon.